
How to Monitor Your Performance in Training

When you train for endurance, you probably follow a training schedule that you have put together based on some principles, or under the supervision of a coach. But even if you have followed progressive overload and optimal recovery measures, the human body has to adjust to many internal loads, such as stress, sleep, travel exhaustion, and inflammation. The body has to cope with these as well as the strain that it goes through while training. In such a situation, it is imperative to measure running progress and understand whether you are getting results from the training plans that you follow.
The cycle of loading the body with physical stressors, followed by rest and sleep, will ensure adaptation and improvement in fitness. You need to maintain a balance between training load and rest to maximize your performance. Taking too much rest will not help. Similarly, excess training load may lead to injury, or you may drift into the overtraining syndrome.
How should you monitor performance?
The best ways to monitor running progress include:
Track weekly mileage or hours
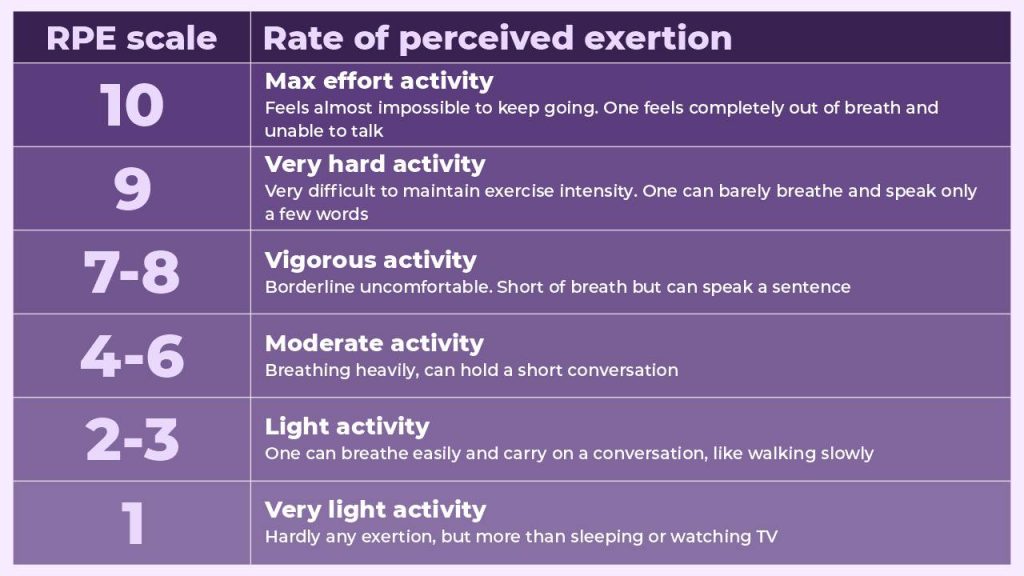
The most essential part of tracking your training is to keep a log or diary. The diary should track variables like distance, time, pace, the rating of perceived exertion (RPE) that is measured on a scale of 1-10, average heart rate (HR), and resting HR.
The simplest guideline is to track your weekly volume in terms of mileage or total hours and apply the 10% rule to see whether you are not exceeding the volume by more than this percentage
However, this method tracks only the external load due to distance run and ignores many internal factors, such as HR and RPE.
Also Read: How to Increase Running Mileage
Calculate the Acute to Chronic Workload (ACWL)
ACWL is a technique that considers both external and internal loads and does the calculation. External load is signified by the duration of your run, while the internal load is your RPE. The scale for RPE is shown in the below visual.
This method is easy to use, and you can automate it using an excel sheet as well.
If you have run for 45 mins and your RPE is 4, then the load for that day is calculated as 45 multiplied by 4, which comes to 180 units. In this way, you can track your load for all the days of the week to get your total weekly load, which is called the Acute Workload (AWL).
Now, the Chronic Workload (CWL) is just the mean of four weeks. We take four weeks so that we can track our adaptation in small lots. The ACWL for any week is now given as a ratio of the AWL for that week divided by the CWL for four weeks. This table shows a sample calculation:
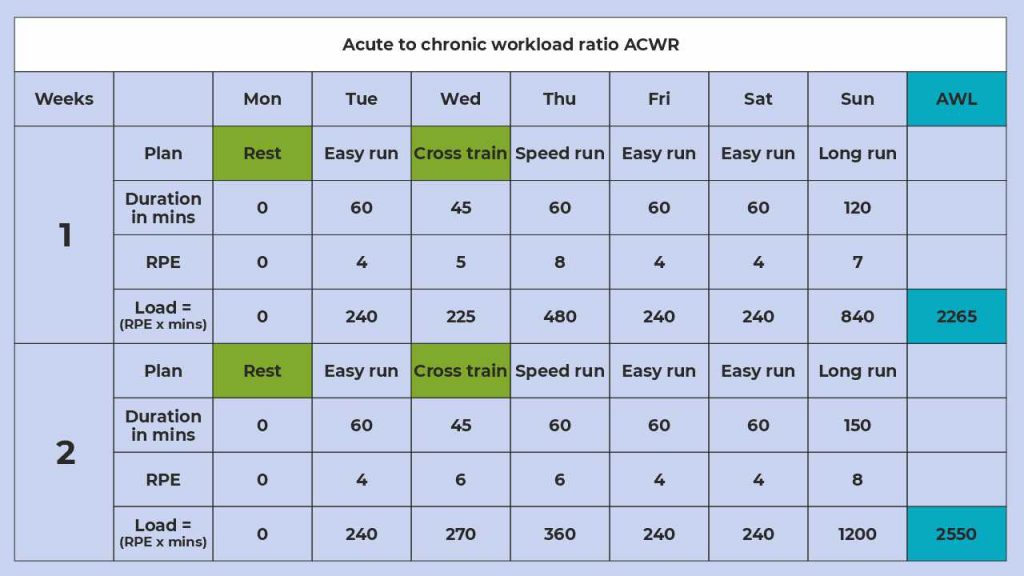
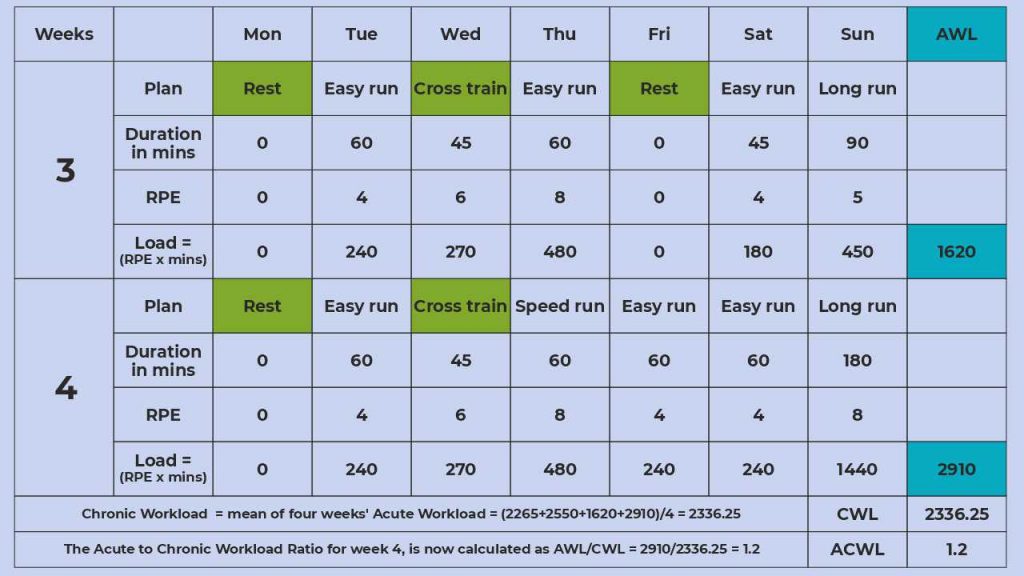
The acute-to-chronic training ratio compares your mileage for the last week to your average weekly mileage for the last four weeks. Tim Gabbett, in his paper on ‘Training-injury prevention’, prescribes that the ideal ACWL should be between 0.8–1.3 to stay on what he called the ‘‘sweet spot’’ in training. In the case of our example, this figure is 1.2, which is within the ‘‘sweet spot’’ range. You can calculate this ratio after every four weeks and ensure that it falls between 0.8-1.3.
Compute the speed at VO2max
If you periodically make this calculation over several weeks during your training period, then an increase in your estimated speed at VO2max at the same HR will mean that you are running faster. For example, the same speed run may feel easier compared to the last time.
With this method, you may measure your speed and HR. The effort level of the run should be at least at a moderate pace of 5-6 in the RPE range for the calculation to be a fair estimate. While running at a moderate pace, you have reached a steady-state. So, the speed and HR should be stable. Take the reading for speed and HR. Also, ensure that you have records of your max HR and resting HR. Now, calculate as follows:
- Speed: 12kmph
- HR: 150bpm
- Max HR: 190bpm
- Resting HR: 50bpm
First, we calculate the heart rate reserve (HRR) using max HR. This is max HR minus Resting HR = 190bpm-50bpm = 140bpm
Next, we calculate the HRR by subtracting the resting HR from HR. So, it will be 150bpm-50bpm = 100bpm.
The ratio is called percent HRR = 100/140 = 0.71 X 100, which comes to 71%.
Now, divide the current speed by the %HRR to get what your speed would be at HRR. This is a close estimate of your speed at VO2max.
Estimated Speed at VO2max = 12/0.71 = 16.9kmph
Do note that this calculation does not take terrain or weather conditions into account. So, while comparing performance, make sure that you always run on a level surface and take measurements for similar weather conditions.
Use GPS watches and apps effectively
Various wearable devices, such as apps and platforms take data and depict indices and estimates of VO2max during training. One such index is called the Running Index. It uses a calculation similar to the one shown above. All these devices and apps transform data to indicate “stress” or “performance” in training. Many have an algorithm that accounts for a change in terrain in terms of inclines or declines.
The plus point is that you need not go through the above calculations because these devices show a value for stress or improvement after a few runs
To sum it up, you may monitor your training and make adjustments with the aid of the above calculations and parameters. However, your training stress and performance is a sum of all variables, such as general health, mood, sleep, nutrition, aches, and rest. How these parameters contribute toward your recovery from training and enable you to push harder will depend on how closely you monitor your overall well-being. Using such monitoring techniques will lower your risk of injury and improve your performance.
Reference
1. Gabbett TJ. The training-injury prevention paradox: should athletes be training smarter and harder? Br J Sports Med 2016; 50: 273-80.
Recommended